Oladapo Hassan has a background in Surveying and Geoinformatics from Lagos, Nigeria. He recently completed his master's in Geo-information Science and Earth Observation with a specialization in Geoinformatics at ITC, University of Twente. Oladapo has a keen interest in Geo-Health, particularly how geoinformation science can be used with health data to support stakeholders make informed decisions. He is currently working on water security and global health, and is involved in a project on water, health sanitation, and hygiene (WASH) conditions in healthcare facilities in Latin American countries. In his spare time, he enjoys reading books and watching football.
How did you come up with your research topic?
After the GCLA course, I concluded that my final thesis would be in the field of Geo-Health. My supervisors (dr. Sherif Amer at PGM and dr. Carmen Anthonj at EOS) suggested I could work on SARS-CoV-2 in wastewater in the Netherlands. Wastewater-based epidemiology is an interesting research field. Past research has explained the usefulness of the collection and analysis of wastewater in the surveillance of diseases such as norovirus, poliovirus, hepatitis, and substances such as drugs and alcohol consumption. Few papers described the relationship between the wastewater concentration of diseases and substances in comparison to other indicators. Since the COVID-19 pandemic was and still is a problem since its outbreak, I believe the novelty of my research would really help provide more insight into the fight against the virus. One interesting thing during the early stages of my research was that only a few studies on SARS-CoV-2 in wastewater explored the relationship between the virus concentration in wastewater and other epidemiological indicators. I found it fascinating to explore some epidemiological indicators across multiple geographical scales – thereby providing more insights into the relationship between these epidemiological indicators.
How is your study related to the dutch Covid-19 dashboard?
Since the outbreak of SARS-CoV-2, different public health bodies have established dashboards hosting information about the virus and providing insight into the spatial and temporal patterns of SARS-CoV-2 transmission. The COVID-19 dashboard in the Netherlands managed by the National Institute for Health and Environment (RIVM), hosts information on the number of positive cases, hospital admissions, and deaths, and includes data on SARS-CoV-2 wastewater concentration. It offers an opportunity to describe the relationship between these epidemiological indicators, describing where they complement and differ. Upon review of the wastewater data from the dashboard, I discovered that the surveillance of SARS-CoV-2 in wastewater had commenced in the first quarter of 2020, with weekly measurements of the number of virus particles in some selected Wastewater Treatment Plants (WWTP) in the Netherlands. By mid-2021, the viral load measurement was extended to over 300 WWTP. In my study, the weekly reading of the wastewater measurement at WWTP was disaggregated to the municipal level. Other epidemiological indicators were also organized at the municipality level. The organization of the epidemiological indicators to a common unit of analysis provided a clear pathway for further spatial and temporal analysis, as shown in figure 1 below. The study also explored the potential of the SARS-CoV-2 wastewater measurement as an early warning indicator to signal (re-)emergence of SARS-CoV-2 transmission in different parts of the Netherlands.
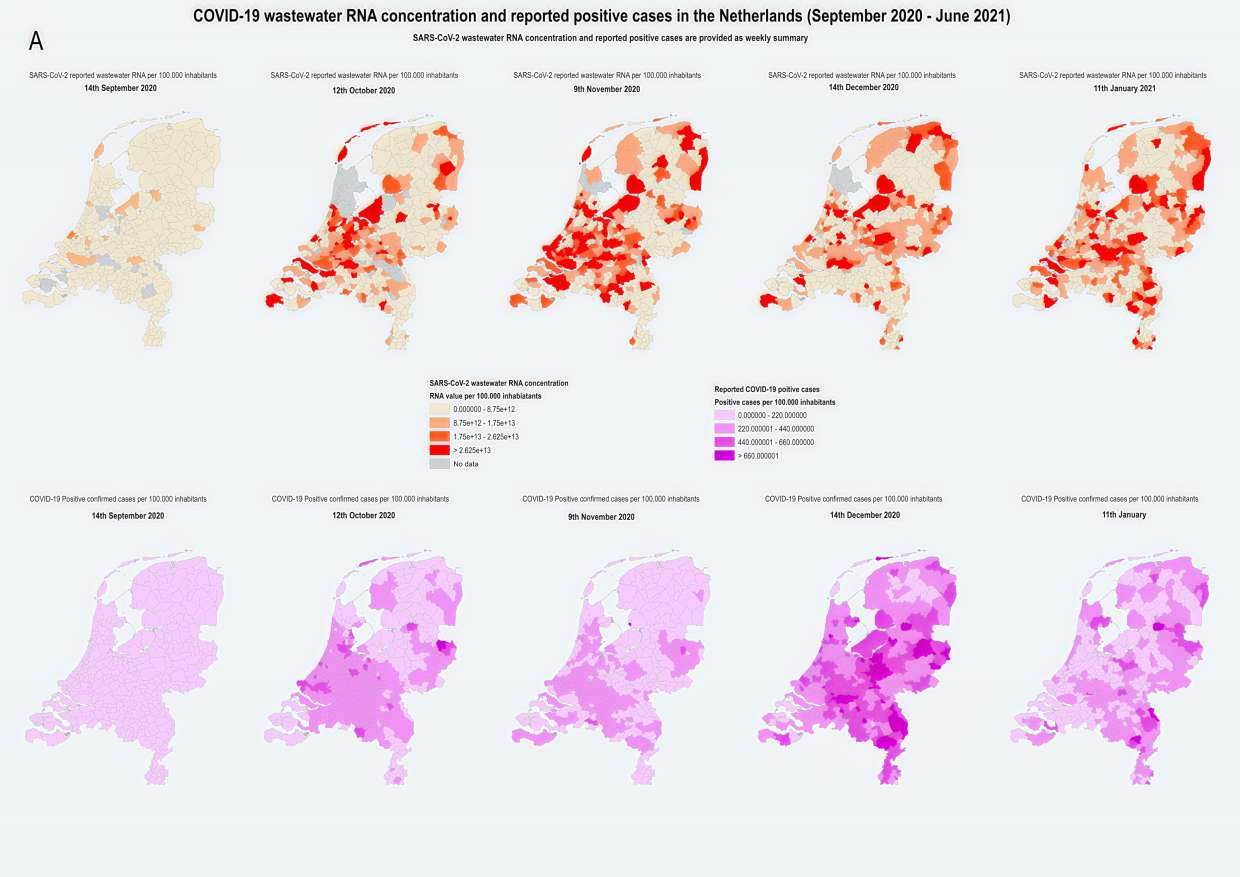
What are the most striking results from your study?
Our research assesses the added value of the SARS-CoV-2 viral loads in wastewater in relation to the standard epidemiological indicator data collected in the Netherlands across space and time, providing a nationwide overview of the spatio-temporal patterns of these epidemiological indicators across different geographical scales. Our analyses confirm that the SARS-CoV-2 wastewater data is a useful complementary epidemiological indicator to explore the spatiotemporal variation of the SARS-CoV-2 transmission intensity. Another interesting result from this research is that it showed that analyzing the wastewater data and other epidemiological indicators at the municipal level can be useful in monitoring of the SARS-CoV-2 transmission intensity in smaller geographical areas. The most interesting part of our study is that, in about half of the municipalities in the Netherlands, an increase in SARS-CoV-2 wastewater RNA concentration precedes increases in weekly positive cases by one or two weeks. These results are useful in providing more insight into the spatial and temporal transmission of the SARS-CoV-2 virus and help public health officials make informed decisions. The multi-geographic analysis of the SARS-CoV-2 wastewater data and other epidemiological indicators makes this study interesting to the field of water research, health research, geoinformation science, and to RIVM.

How can spatial data help policymakers when working on wastewater issues in the Netherlands?
We describe the usefulness of wastewater data in the identification of re-emerging infections, and for identifying infection hot spots to potentially be targeted by interventions. We explain how looking at small-scale spatial units, such as a municipality can facilitate targeted interventions and measurements. Inclusion of the temporal aspect to support the spatial occurrence in wastewater analysis provide an understanding of the spatio-temporal trends, consequently, facilitating timely interventions to contain the virus.
What is your next plan?
I found so much joy in the outcome of the thesis including the recommendations for decision-making. Upon completion of my research, I observed that the wastewater data is now being published daily by the RIVM. As stated by the RIVM (2021): “The sewage surveillance would enable early detection in the event of localized outbreaks and recognize new variants”. So, I would like to work more on the improved data to observe the relationship between the daily wastewater data and the epidemiological indicators. But firstly, I would like to publish the research in a scientific journal. I would like to work more on wastewater-based epidemiology, water, sanitation and hygiene, and Geo-Health-related research.
References
RIVM (2021) Coronavirus monitoring in sewage research, RIVM National Institute for Public Health and the Environment. Available at: https://www.rivm.nl/en/covid-19/sewage.
Staff involved

