The United Nations identified seventeen Sustainable Development Goals (SDGs) to address the most pressing problems facing our world. Well-designed maps and diagrams can assist in achieving these goals. With this in mind, the International Cartographic Association together with United Nations Geospatial Information Section has written the book Mapping for a Sustainable World. One of the main writers was Menno-Jan Kraak, UT Professor in Geovisual Analytics and Cartography (Faculty of ITC).
Figure 1. Book Cover
The design of maps and diagrams is an intentional process, and the same subject can be mapped or charted in several different, equally appropriate ways. However, some design decisions are suboptimal for particular mapping contexts. The book summarizes guidelines for mapping geographic datasets related to the SDGs by introducing basic principles of map design and use, discussing established best practices and conventions, and explaining how different mapping techniques support understanding of the SDGs.
Common pitfalls
"We emphasize common pitfalls resulting in flawed or even misleading maps and diagrams, but our goal is not to suggest these guidelines as hard-and-fast rules required in all mapping contexts", explains Kraak. Problems can also originate in other ways than the pitfalls mentioned in the book. For example from improper data handling, distracting symbols and text, confusing map elements, and the (mis)use of software defaults. "Our objective is to encourage mapmakers of all kinds to be more intentional about these cartographic design decisions. Reasons to break from our recommendations are myriad, but they should be made with careful and collective consideration of the map use and user context", says Kraak.
Cartography at ITC
Although the book offers a generic view of cartography, it does directly touch upon the research work of cartographers and data visualizes at the Faculty of ITC. We concentrate on developing and evaluating online alternative graphic representations that can depict changes over time. "We do so in interactive online environments, offering the user a multitude of options to ‘play’ with the map", explains Kraak. For example, in the maps shown in Figure 2. It represents SDG indicator 9.c.1; the proportion of the population covered by a 2G mobile network. The user can change the map type, the classification and the year.
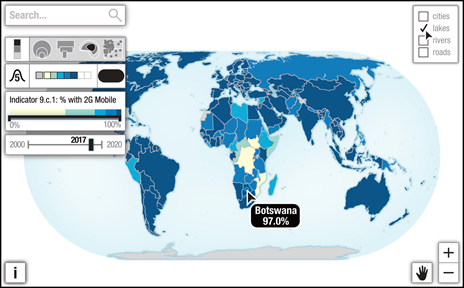
Figure 2. An interactive map on the proportion of the population covered by a 2G mobile network.
Figure 3 is another example of Kraak's work. It shows an interactive dashboard that provides a visual summary of data of SDG indicator 9.4.1 on CO2 emissions. It contains a proportional symbol map, a stream graph, and a cartogram, supporting multiple perspectives on the indicator. Coordinated interaction across these multiple views is essential to support open-ended exploration and in-depth analysis and allows one to reveal previously unknown insights into patterns, trends, and anomalies across a range of datasets.
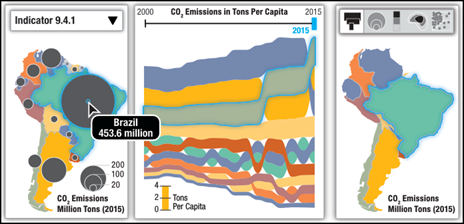
Figure 3. Interactive dashboard on SDG indicator 9.4.1 on CO2 emissions.
Map evaluation
The evaluation of our product is just as critical as their development. The usability of a map is critical to the overall user experience, or the process that leads to a successful and satisfying outcome. "In our VISUSE lab, we apply a robust user-centred design process that seeks feedback early and often from the intended audience", says Kraak. Figure 4 shows a map design of SDG indicator 5.5.1 for the general interested public. The map is accompanied by photographs, and explanatory text providing context to the indicator and provides justification for the map design.
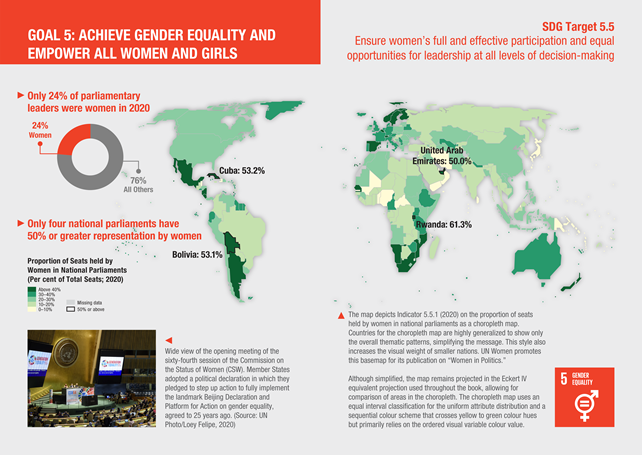
Figure 4. A map design of SDG indicator 5.5.1 on gender equality
Open access
This work is published as an open-access document according to the CC BY-NC license. However, not only the book is open access, but also the SDG indicator data is freely accessible, and the geographic data used to create the made will become freely available too. The aim is to translate the book into the six official languages of the United Nation and currently the authors work on additional educational material to be used to train people in the United Nations organization and other interested parties such are regions in the Global South. The book is also used in the ErasmusPlus International MSc Cartography (a joint degree between the universities of Twente, München, Wien and Dresden)
More information
Prof. Dr. Menno-Jan Kraak is a professor at the Department of Geo-information Processing (GIP; Faculty of ITC) and Past President of the International Cartographic Association (ICA). Together with Robert E. Roth (ICA), Britta Ricker (ICA), Ayako Kagawa (UN), Guillaume Le Sourd (UN), he published the book entitled Mapping for a sustainable World. It is open access and can be read here.
More recent news
 Wed 25 Mar 20264TU.Health Event 2026 sets course for collaborative healthcare innovation
 Tue 17 Mar 2026Rising temperatures can delay the arrival of spring
 Thu 5 Mar 2026Tom Loran says goodbye to ITC
 Thu 19 Feb 2026Project SEEN‑ATLAS Receives European Funding
 Wed 18 Feb 2026Master's in Geo-information Science and Earth Observation recognised as an initial Master's