OOA-group
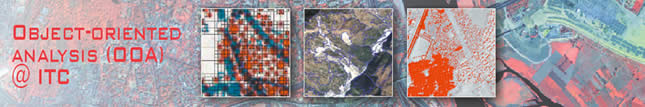
What is object-oriented analysis (OOA)?
Image analysis has traditionally been primarily based on pixels and their spectral information. Even more recently developed methods, such as those based on texture, advanced classification or multi-data integration, tend to have difficulties to support contextual analysis. The idea of object-oriented analysis (OOA) is that images are broken down into spectrally homogenous segments or objects, whereby the size and shape can be constrained by a number of parameters, and that additional thematic layers, such as of cadastral boundaries or geological units, can be used to create meaningful segments. For all created segments a large number of parameters can be automatically calculated, providing information on all aspects, such as the segment’s spectral characteristics, texture, shape, orientation, proximity or adjacency to other objects, etc. All of those characteristics can then be used to develop rules that are in turn used to classify the segments. As often different spatial scales can exist in an image (for example we might be interested in a single tree or an entire forest stand, or a chimney vs. the entire roof), a multi-scale segmentation is also possible, leading to different segmentation levels.
The relationship of a given object to its so-called super- or sub-objects can then also be used. The strength of OOA is that we can thus effectively integrate process and feature knowledge, which is not possible with most other image processing methods. For example, we can automatically distinguish a swimming pool from a natural pond or other water body based on what we know to define either, or even characterize a certain urban neighbourhood, such as formal or informal, based on our definition and concept of those urban settlement types. In effect, OOA is well suited to study not only landcover, but also land use, and lends itself well to distinguish subtle process differences such as between different landslide types by integrating spectral, shape and geomorphometric parameters.
What does ITC’s OOA Group do?
At ITC we have been conducting research in object-oriented analysis since 2006, focusing on a large range of research problems. This reflects that OOA is a very versatile analysis approach that is of use wherever we want to conduct knowledge-driven processing, i.e. where we can specifically characterize features or processes of interest. To date, the group has focused on the following research fields, using OOA:
- Assessment of social vulnerability
- Assessment of structural disaster damage
- Coal fire-related landcover mapping
- Detection of erosion features (gullies and rill erosion), and characterisation in the context of land use systems
- Extraction of urban elements at risk (e.g. buildings) for improved flood modelling
- Floodplain characterization for improved surface roughness assessment
- Information extraction from (hardcopy) legacy population maps
- (Semi-)automatic detection and type characterisation of landslides
- Slum mapping and characterization
- Urban structural assessment, including automatic delineation of homogenous urban patches (structurally and formally homogenous areas with clear boundaries), and road network extraction
In addition, we currently focus on more objective segmentation, as well as on reducing the data- or threshold-driven processing that has been characterising OOA work, but which limits transferability of the developed rule sets.
group members and their projects
External Collaborators

Former Group Members
OOA-related journal articles
van den Eeckhaut, M., Kerle, N. and ... [et al.] (2012). Object - oriented identification of forested landslides with derivatives of single pulse LiDAR data. Geomorphology (in press).
Martha, T.R., Kerle, N., van Westen, C.J., Jetten, V.G. and Kumar, K.V. (2012). Object - oriented analysis of multi - temporal panchromatic images for creation of historical landslide inventories. ISPRS Journal of Photogrammetry and Remote Sensing, 67 (2012) pp. 105-119.
Kohli, D., Sliuzas, R.V., Kerle, N. and Stein, A. (2012). An ontology of slums for image - based classification. Computers, Environment and Urban Systems, 36(2), pp. 154-163.
Stumpf, A. and Kerle, N. (2011) Object-oriented mapping of landslides using Random Forests. Remote Sensing of Environment, 115(10), pp. 2564-2577.
Gao, Y., Mas, J. F., Kerle, N., & Navarrete Pacheco, J. A. (2011). Optimal region growing segmentation and its effect on classification accuracy. International Journal of Remote Sensing, 32(13), 3747-3763.
Shruthi B.V., Kerle, N and Jetten, V. (2011). Object-based gully feature extraction using high spatial resolution imagery. Geomorphology, 134(3-4), pp. 260-268.
Martha, T.R., Kerle, N., van Westen, C.J., Jetten, V.G. and Kumar, K.V. (2011). Segment optimization and data - driven tresholding for knowledge - based landslide detection by object - based image analysis. IEEE Transactions on Geoscience and Remote Sensing, 49(12), pp. 4928-4943.
Das, I., Stein, A., Kerle, N. and Dadhwal, V. (2011). Probabilistic landslide hazard assessment using homogeneous susceptible units, HSU, along a national highway corridor in the northern Himalayas, India. Landslides, 8(3), pp. 293-308.
Lu, P., Stumpf, A., Kerle, N. and Casagli, N. (2011). Object - oriented change detection for landslide rapid mapping. IEEE Geoscience and Remote Sensing Letters, 8(4), pp. 701-705.
Martha, T.R., Kerle, N., Jetten, V.G., van Westen, C.J. and Vinod Kumar, K. (2010). Characterising spectral, spatial and morphometric properties of landslides for semi - automatic detection using object - oriented methods. Geomorphology, 116 (1-2), pp. 24-36.
Kerle, N. and de Leeuw, J. (2009). Reviving legacy population maps with object - oriented image processing techniques. IEEE Transactions on Geoscience and Remote Sensing, 47(7), pp. 2392-2404.
Ebert, A., Kerle, N. and Stein, A. (2009). Urban social vulnerability assessment with physical proxies and spatial metrics derived from air- and spaceborne imagery and GIS data. Natural Hazards, 48(2), pp. 275-294.
Yan Gao, Kerle, N. and Mas, J.F. (2009). Object based image analysis for coal fire related land cover mapping coal mining areas. Geocarto International, 24(1), pp. 25-36.
Conference proceedings
Stumpf, A., Lachiche, N., Kerle, N. and Malet, J-P. (2012) Adaptive spatial sampling with active Random Forest for object-oriented landslide mapping. Proceedings of IGARSS, 22-27 July 2012 Munich, Germany.
Stumpf, A., Lachiche, N., Kerle, N. and ... [et al.] (2012) Adaptive sampling and object feature selection for landslide mapping using Random Forests. In: Proceedings of the 4th GEOBIA 2012: Geographic object - based image analysis, May 7-9, 2012 Rio de Janeiro Brazil. São José dos Campos, Brazilian National Institute for Space Research (INPE), 2012.
Martha, T.R. and Kerle, N. (2012) Creation of event - based landslide inventory from panchromatic images by object-oriented analysis. In: Proceedings of the 4th GEOBIA 2012: Geographic object - based image analysis, May 7-9, 2012 Rio de Janeiro Brazil. São José dos Campos, Brazilian National Institute for Space Research (INPE), 2012.
Shruthi, R.B.V., Kerle, N. and Jetten, V.G. (2012) Extracting gully features and their dynamics from high spatial resolution imagery using object based image analysis. In: Proceedings of the 4th GEOBIA 2012: Geographic object - based image analysis, May 7-9, 2012 Rio de Janeiro Brazil. São José dos Campos, Brazilian National Institute for Space Research (INPE), 2012.
van den Eeckhaut, M., Kerle, N. and ... [et al.] (2012) Identification of vegetated landslides using only a lidar - based terrain model and derivatives in an object-oriented environment In: Proceedings of the 4th GEOBIA 2012: Geographic object - based image analysis, May 7-9, 2012 Rio de Janeiro Brazil. São José dos Campos, Brazilian National Institute for Space Research (INPE), 2012.
Kohli, D., Kerle, N. and Sliuzas, R.V. (2012) Local ontologies for object - based slum identification and classification In: Proceedings of the 4th GEOBIA 2012: Geographic object - based image analysis, May 7-9, 2012 Rio de Janeiro Brazil. São José dos Campos, Brazilian National Institute for Space Research (INPE), 2012.
Stumpf, A., Malet, J.P. and Kerle, N. (2012) Mapping landslide surface fissures with matched filtering and object-oriented image analysis. In: Proceedings of the 4th GEOBIA 2012: Geographic object - based image analysis, May 7-9, 2012 Rio de Janeiro Brazil. São José dos Campos, Brazilian National Institute for Space Research (INPE), 2012.
Stumpf, A. and Kerle, N. (2011) Combining random forest and object - oriented analysis for landslide mapping from very high resolution imagery: In: Spatial statistics 2011, 23-25 March, 2011, University of Twente, Enschede, The Netherlands / editor A. Stein, , E. Pebesma, , G.B.M. Heuvelink. - Enschede: University of Twente Faculty of Geo-Information and Earth Observation ITC, 2011. 2 p.
Lu, P., Casagli, N., Catani, F., Tofani, V., Stumpf, A. and Kerle, N. (2010) Rapid mapping and detection of landslides through remote sensing. In: Mountain risks: bringing science to society: proceedings of the Mountain Risks International Conference, Firenze, Italy, 24-26 November 2010 / ed. by J.-P. Malet, T. Glade and N. Casagli. - Strasbourg : CERG, 2010. ISBN 2-95183317-1-5. pp. 19-24.
Martha, T.R. and Kerle, N. (2010) Segment optimisation for object - based landslide detection. In: GEOBIA 2010, 29 June-2 July 2010, Ghent, Belgium: proceedings / editor E.A. Addink, F.M.B. Van Coillie. - [s.l.]: International Society for Photogrammetry and Remote Sensing (ISPRS), 2010. - (International Archives of Photogrammetry and Remote Sensing: IAPRS : ISPRS ; XXXVIII-4/C7). 6 p.
Kerle, N. and Martha, T.R. (2010) Potential of object - based and cognitive methods for rapid detection and characterisation of landslides. GI4DM 2010: 6th International Symposium on Geo-information for Disaster Management, 2-4 February 2010, Torino, Italy. 6 p.
Sliuzas, R.V., Kerle, N. and Kuffer, M. (2008) Object - oriented mapping of urban poverty and deprivation. In: Proceedings of the 4th EARSeL workshop on remote sensing for developing countries in conjunction with GISDECO 8, June 4-7, 2008, Istanbul, Turkey / European Association of Remote Sensing Laboratories (EARSeL), 12 p.
Shamaoma, H., Kerle, N. and Alkema, D. (2006) Extraction of flood - modelling related base - data from multi - source remote sensing imagery. In: ISPRS mid-term symposium 2006 remote sensing: from pixels to processes, 8-11 May 2006, Enschede, the Netherlands, 7 p.
eCognition corner
Most of the OOA work of the group is being carried out with Definiens’s eCognition software. In principle developed methods should be transferable to other data types and areas, though this needs for testing, and adaptation will be needed. Here we make available test data sets and our developed rule sets that can be downloaded, which can also be used for training purposes.
» Download data and rule sets
![]()
If you have questions about the procedures, or ideas for collaboration, please contact Dr. Norman Kerle
Events the group is contributing to