FAO has launched the WaPOR which allows the retrieval of various types of remote sensing based products, facilitating the calculation of the Water Productivity at different spatial resolutions. At African continental level data is available at 250 meters resolution (level 1) and for selected regions at 100 meters resolution. Some products are daily, but mainly the data is provided at dekadal temporal resolution. For further information on WaPOR see: https://wapor.apps.fao.org/home/WAPOR_2/1.
A short introduction to Water Productivity and the WaPOR data base can be obtained from here:
https://filetransfer.itc.nl/pub/52n/ILWIS386/documents/introduction-to-wp-wapor.pdf
A manual Gross and Net Water Productivity computation example (using excel) is available from here:
https://filetransfer.itc.nl/pub/52n/ILWIS386/documents/wp-manual-calculation-example.xlsx
In order to efficiently process the time series data a small extension under ILWIS was developed, the FAO Frame toolbox. This utility allows structured pre‐processing of version 1 and version 2 data provided through WaPOR of both level 1 and level 2. Based upon the products provided, subsequently the Water Productivity can be calculated. This is done at dekadal time step and these maps can be aggregated showing the (user defined) seasonal or annual water productivity.
Based on (MSc and PhD) research preferences and validation requirements two level 1 regions, namely Kenya and Sudan, as well as 2 level 2 regions, the Naivasha Basin (Kenya) and the Gezira irrigation scheme (Sudan) have been pre‐defined. Other regions can be easily added once the bounding coordinates are defined, based on the ILWIS service objects ‘georeference’ and ‘coordinate system’. The toolbox assumes that the input data is locally available.
After installation of the FAO-Frame-Toolbox plug-in a new tab, called “FAO-Frame Toolbox”, will appear in the ILWIS Operation-Tree.
FAO‐FRAME Toolbox menu.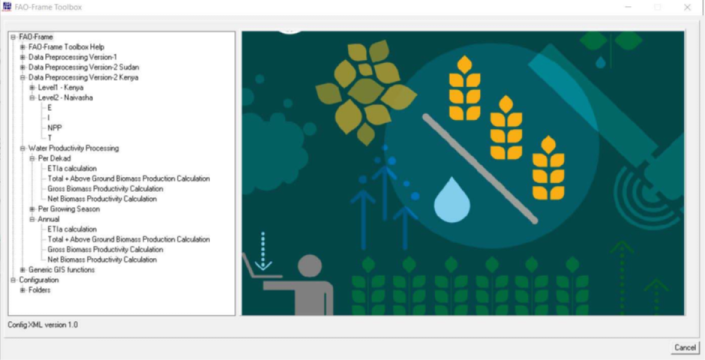
To efficiently create the required time series data the products can be imported via the toolbox menu, the ILWIS command line generated can be pasted into a batch routine and based on batch (loop) processing the required data can be (pre‐) processed. Also ILWIS scripts, used to calculate the Water Productivity can be executed using batch routines. This requires minimum efforts by the user once the batch routines are created and all data is processed using identical routines, minimizing user errors.