Academic research in almost any discipline is impossible without software. But universities do not always have the expertise to develop this specific kind of research software. That is why NWO and SURF founded the Netherlands eScience Center ten years ago. Prof. Raúl Zurita Milla pioneered with big data, thanks to the Center.
This article was originally published on surf.nl. Below is an edited extract from this article.
Studying the green wave
“During fall, plants are losing their leaves. In spring, we will see them bloom. The science that studies these cyclical biological events is called phenology. The timing of these occurrences varies from place to place and from year to year, depending on the environmental conditions”, explains Raúl Zurita Milla, a professor of Spatio-temporal analytics at ITC.
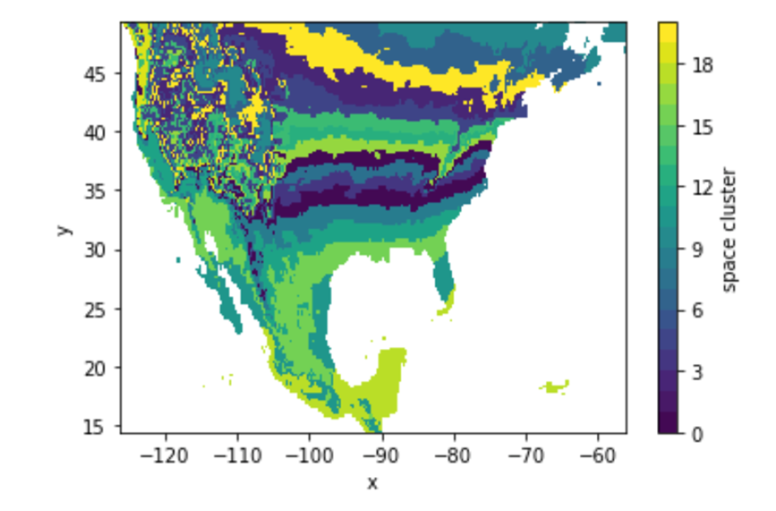
“We study changes in what we call the ‘green wave’: the transition from winter, when everything is dormant, to the arrival of spring, when everything comes back to life. We make maps that show this green wave moving from south to north. In the Netherlands, spring comes later than in southern Spain, where I am from, and it arrives even later in Norway.” The green wave models are based on phenological observations from volunteers, Zurita Milla says. “You take your children to school, and you notice: hey, this tree didn’t have leaves last week and today it has. You can report this to a phenological network. These networks help to collect millions of observations.”
Disaster
Zurita Milla and his team combine this information with environmental data such as temperature and day length to map the arrival of spring. “Seeing how the green wave changes over time, gives us insight into the impact of climate change. It also has a practical agricultural application: farmers may need to plant at different times or use different varieties. And, as you can imagine, it would be a disaster if there was a temporal mismatch between blooming and pollinating insects, or between the arrival of spring and the timing of the last frost. There are health aspects too. Ticks also have phenology, and humans go into nature at certain times of the year. So phenological studies can help to forecast the chance of more bites. At the moment, we are also working on modelling pollen. So that patients with hay fever can take their medication on time or avoid high pollen areas.”
Because he wanted to do large-scale phenological studies over Europe and the continental US, Zurita Milla approached the eScience Center a few years ago. “I had a lot of data. Our models were also relatively slow and we wanted to speed them up by running them on distributed systems.”
Ready-to-use tools for Earth Observation
For several years, Zurita Milla, the eScience Center and SURF worked in a so-called alliance project, that enabled them to learn from each other. “They wanted to know more about geospatial data, and we wanted to acquire knowledge about big data solutions. We discussed the algorithms in and out with the research software engineers at the eScience Center, and SURF provided the computing infrastructure.” With the insights from this project and similar ones, the eScience Center and SURF have now developed ready-to-use tools, infrastructure and storage for Earth Observation data. “This has lowered the entry barrier to big data for the geospatial community.”
More information
You can read the full article on surf.nl. More information about the eScience Center is on www.esciencecenter.nl.
More recent news
 Wed 25 Mar 20264TU.Health Event 2026 sets course for collaborative healthcare innovation
 Tue 17 Mar 2026Rising temperatures can delay the arrival of spring
 Thu 5 Mar 2026Tom Loran says goodbye to ITC
 Thu 19 Feb 2026Project SEEN‑ATLAS Receives European Funding
 Wed 18 Feb 2026Master's in Geo-information Science and Earth Observation recognised as an initial Master's