The urban environment is complex and, as an interdependent system, vulnerable to natural hazards, like floods, earthquakes, hurricanes, and deformations. Land deformation has become a serious urban problem in recent decades because of groundwater extraction and mining exploration. It causes extensive damage to infrastructure, such as to roads, bridges, and buildings and is a potential threat to human life. We, therefore, need automatic procedures to detect deformation areas and assess their risks before they cause damage. This work aimed to present a method for obtaining a wide range of InSAR results that allow one to detect and predict deformations, specifically in urban environments.
The method uses the latest SAR image acquisitions and includes a Persistent Scatterer (PS) based concatenation component for wide-range deformation mapping, a deep learning component for deformation detection and prediction, and metrics for assessment of the results.
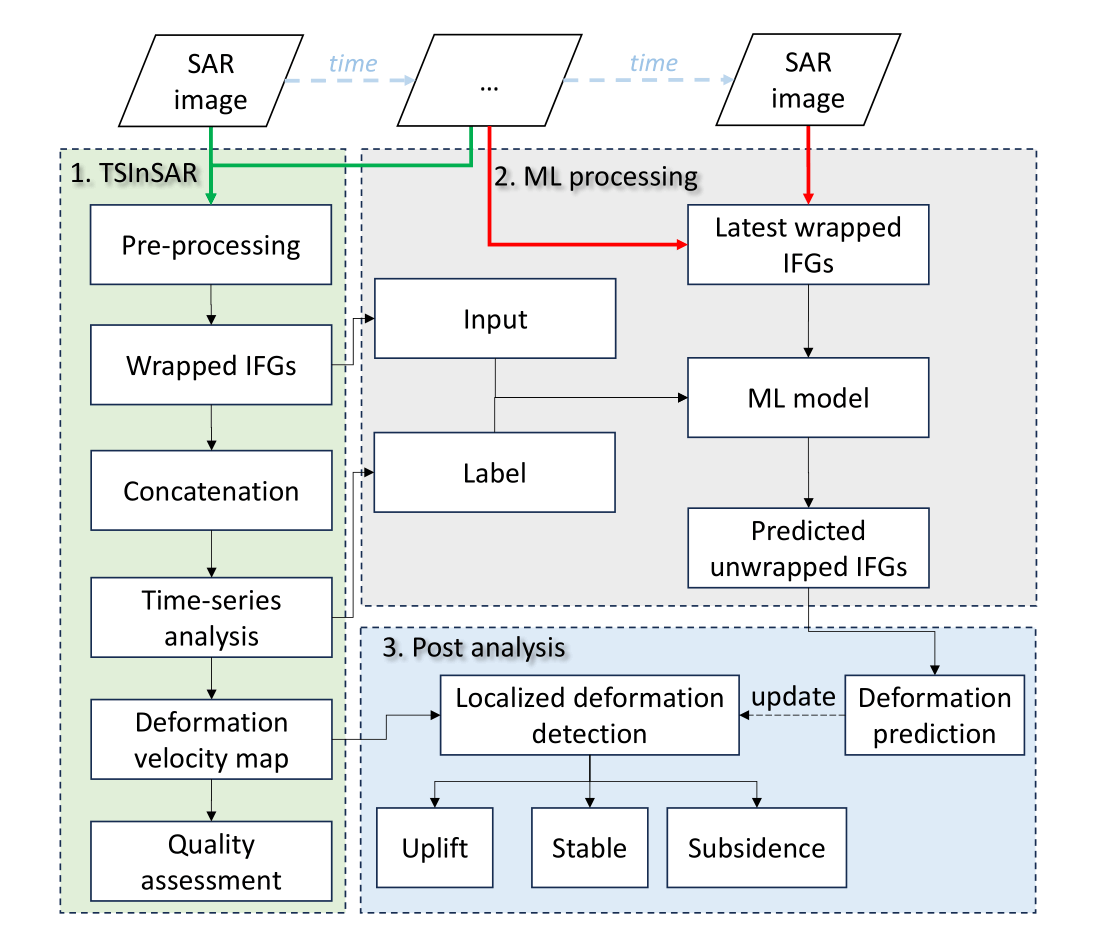
Figure 1: Proposed flowchart with three steps: TSInSAR, ML processing, and post analysis. The concatenation in the first step is further illustrated in Figure 2.
In detail, the time-series InSAR (TSInSAR) processing included pre-processing, generation of wrapped interferograms (IFGs), concatenation, time-series analysis, calculation of deformation velocity maps, and quality assessment. The wrapped IFGs served as the input data for the machine-learning model, while the corresponding labels were derived from the unwrapped IFGs obtained during the time-series analysis step. The deformation velocity maps aided in localized deformation detection.
For the machine learning process, the latest available SAR image was utilized to generate the most recent wrapped IFGs for prediction purposes. The predicted results underwent post-analysis in the final step, where they were reclassified into uplift, stable, and subsidence areas.
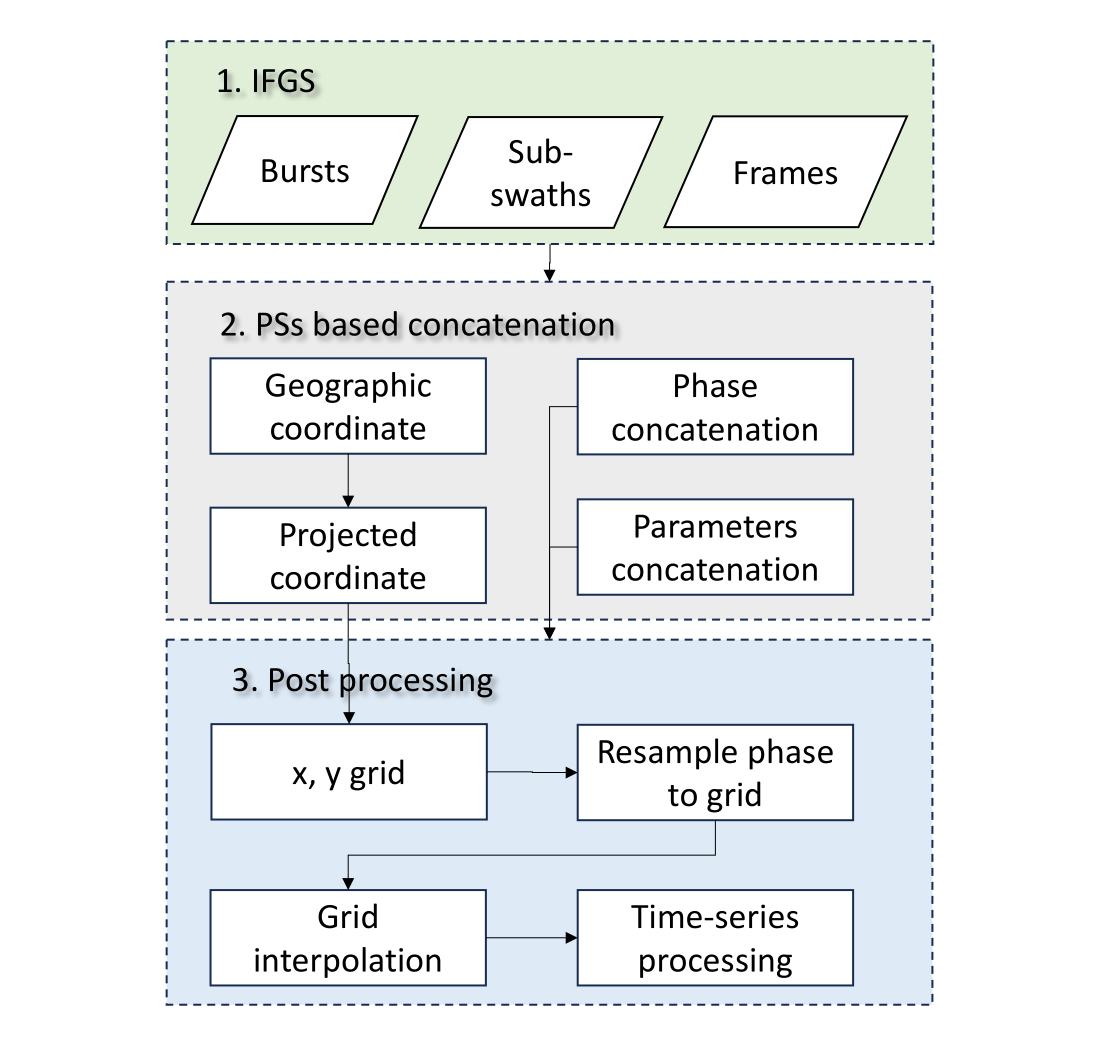
Figure 2: Concatenation flowchart. IFGS represents InSAR products prepared for concatenation, including bursts, sub-swaths, and frames. PSs based concatenation describes the main steps in concatenating the InSAR products based on PS points. Post processing details the procedures applied after concatenation.
We implemented our proposed method on the Geospatial Computing Platform of CRIB. The time series results of Sentinel-1 images on Frame 420 situated in Path 37 were concatenated and presented in Figure 3. Panel (a) shows results obtained using the traditional method, while panel (b) displays results generated using our proposed method. The concatenation result showed improvement upon visual interpretation and was validated using two leveling points, DVTR and D577.
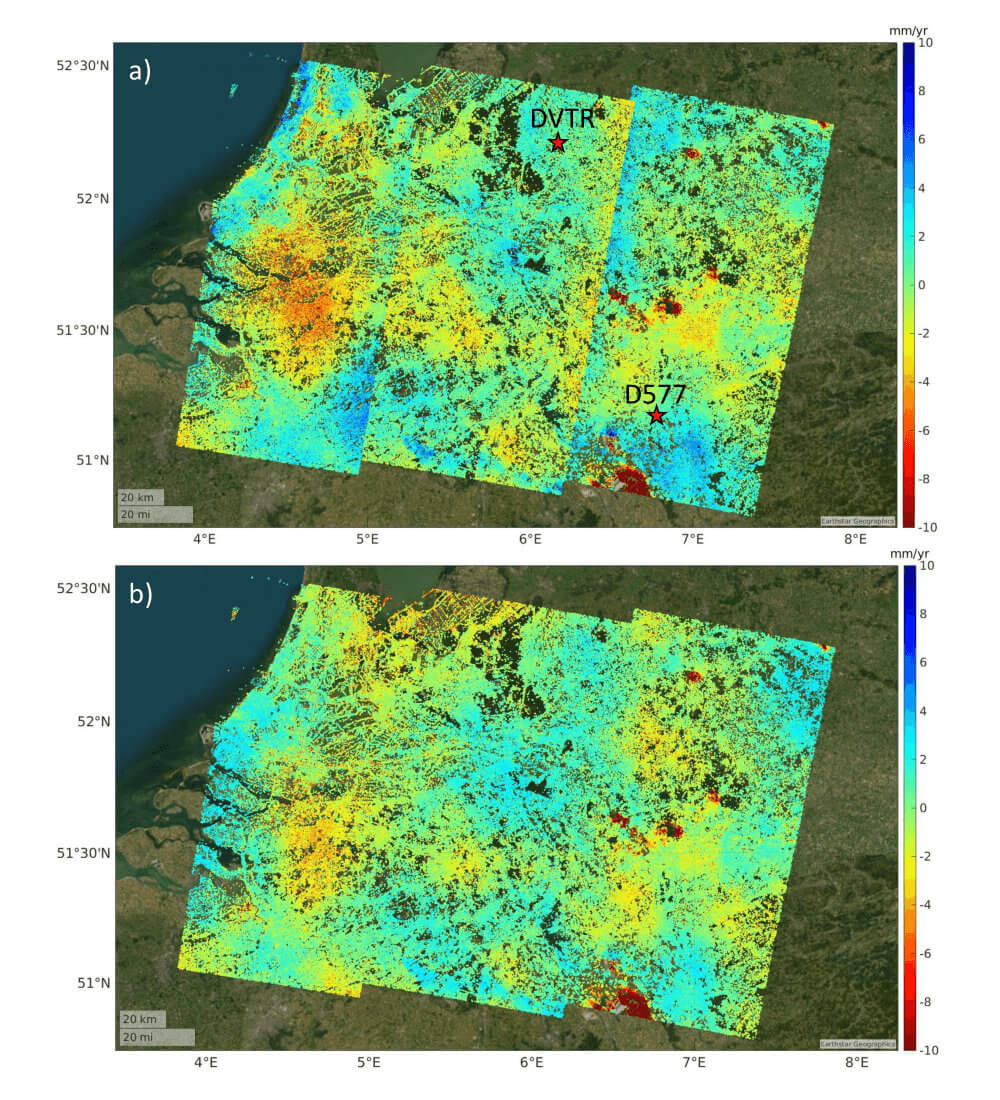
Figure 3: TSInSAR results of whole Sentinel-1 Frame 420 in path 37, which consist of sub-swath 1, 2, and 3 from right to left. (a) is the result before concatenation, while (b) is after. Red stars in (a) indicate leveling points DVTR and D577.
We concatenated three Sentinel-1 images, each covering 250 km by 250 km, into a time series and reclassified the deformation velocity based on the standard deviation of the deformation velocity. The reclassified deformation velocity map is shown in Figure 4 for further exploration.
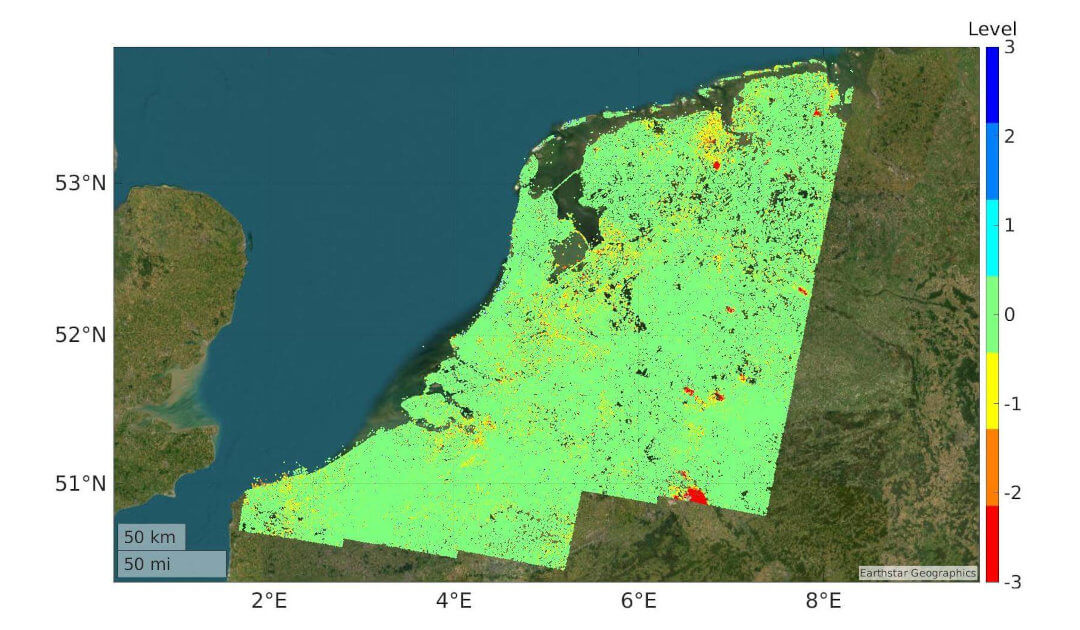
Figure 4: The reclassified deformation velocity map. The smaller level indicates severe deformation.
One of the main challenges in our project is the storage space. One raw SAR images is around 4 GB while we have 3 frame of SAR images and each frame has around 60 raw SAR images. There are at least 180 raw SAR images and their size is 720 GB. Moreover, the required space increases to 9.2 TB after data processing. A large memory is also needed during the data processing, especially for the matrix operation.
Luckily, we have Geospatial Computing Platform that can handle the large data storage and processing. The platform’s powerful computational capabilities, extensive data storage, and high-performance hardware enabled efficient processing of large SAR datasets. It's user-friendly interface, flexible hardware and software support provided a seamless research environment, allowing for efficient workflow execution. The CRIB team was helpful throughout this process, offering continuous support at all times. They even assisted in installing necessary software and packages upon request. Their prompt responses, insightful discussions, and proactive monitoring of hardware and algorithm performance ensured a robust and reliable computing experience. The combination of technical excellence, flexibility, and a highly supportive environment made the research process not only productive but also encouraging and enjoyable.
For more information:
Zhang, X., Chang, L., Girgin, S., & Stein, A. (2025). Creating and leveraging SAR benchmark datasets to facilitate machine learning application. International Journal of Applied Earth Observation and Geoinformation, 142, 104722. https://doi.org/10.1016/j.jag.2025.104722