Time series of remote sensing data have more value than a single image, as they show dynamics. For vegetation, the dynamics within a growing season (also known as phenology) can be characterised by two crucial numbers: the start of the growing season (SOS) and the end of the growing season (EOS). Until recently, there has been a scale mismatch between geospatial datasets powered by MODIS (500 m) or AVHRR (8 km), available validation data like Deutscher Wetterdienst (DWD) with 5-km footprints, and agricultural field sizes that are much smaller. In 2021, Copernicus released a gridded 10-meter High-Resolution Vegetation Phenology and Productivity (HR-VPP) dataset to address the field scale mismatch. Our work provides the first comprehensive validation of the HR-VPP, collecting adequate (field-scale) validation data.
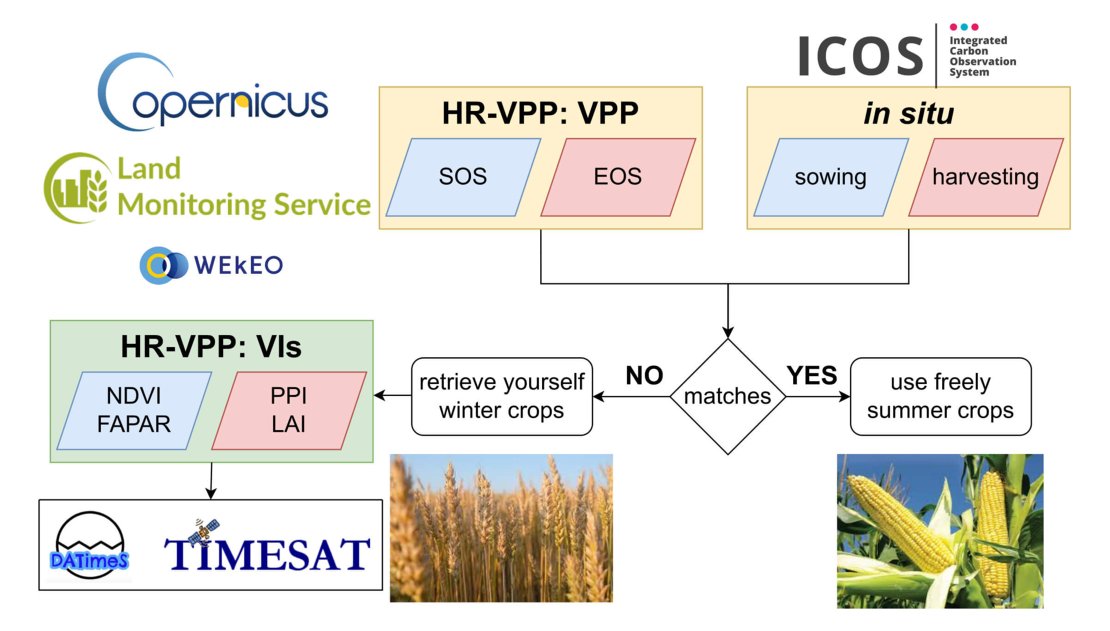 Figure 1. Workflow of the study. HR-VPP: Copernicus high-resolution vegetation phenology and productivity dataset, SOS: start of the growing season, EOS: end of the growing season, VI: vegetation indices dataset, NDVI: normalized difference vegetation index, FAPAR: fraction of absorbed photosynthetically active radiation, PPI: plant phenology index, LAI: leaf area index.
Figure 1 illustrates the steps undertaken in this study:
- Collected field data on sowing and harvesting dates and crop types from principal investigators (PIs) and published papers, amounting to 164 data points.
- Downloaded HR-VPP data.
- Evaluated the initial performance of the HR-VPP data.
- Improved the performance specifically for winter crops by customising the algorithms.
The initial evaluation revealed that the VPP SOS and EOS for spring crops (such as sunflower and bean) matched the measured sowing and harvesting dates very well (SOS: r2=0.71, bias = +59 days; EOS: r2=0.76, bias = +3 days). However, for winter crops, we observed that the VPP dataset often only identified either the autumn growing period (for rapeseed) or the spring growing period (for winter wheat), as depicted in Figure 2. This unsatisfactory performance was improved using the full time series from the VI dataset and applying custom algorithms (DATimeS and TIMESAT). Specifically, NDVI and FAPAR proved most effective for SOS retrieval, while PPI and LAI performed best for EOS retrieval.
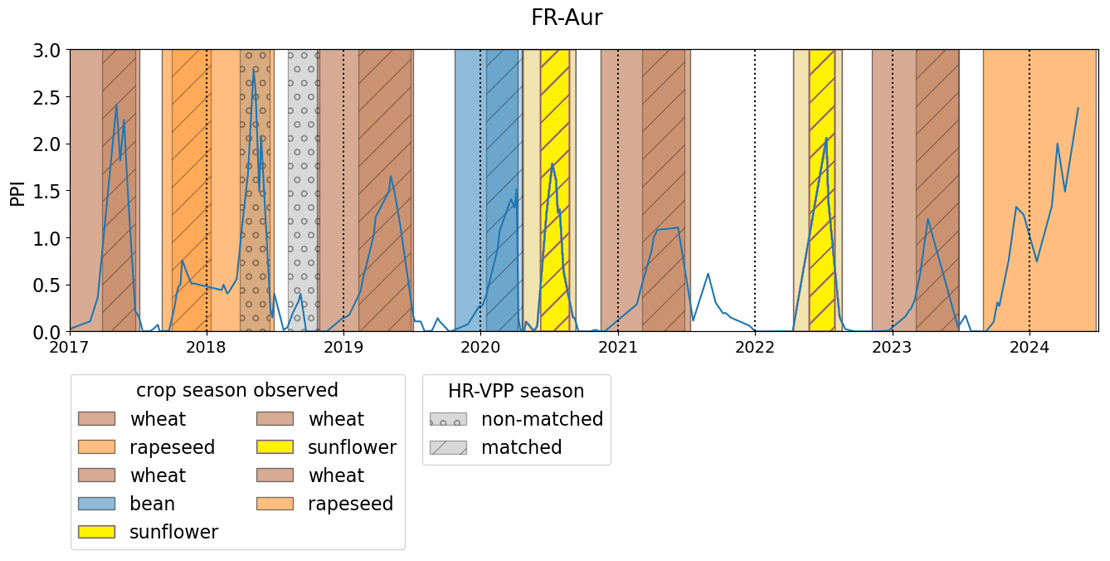 Figure 2. Vegetation phenology over the Auradé (FR-Aur) ICOS study site in France. The blue line is the PPI (plant phenology index) from the HR-VPP VI dataset. The shaded areas indicate the observed growing season of crops (winter wheat, rapeseed, bean and sunflower). The hatches indicate the HR-VPP growing seasons from the VPP dataset, dashed: matched with field observations, dotted: non-matched ("extra").
A significant bottleneck in the processing workflow was the download of satellite imagery. The images were sourced from WEkEO, whose Harmonized Data Access (HAD) API underwent several updates during the paper preparation. Furthermore, this API initially imposed a limit of 100 images per hour, although this restriction was lifted upon request (we acknowledge WEkEO for their support). Considering the study's time span of 8 years, the Sentinel-2 5-daily overpass time, and the 164 data points, we calculated the necessary number of images to download as 8×(365/5)×164=95,776 images.
While the tasks of downloading, cropping, and storing images did not demand significant computational resources, they necessitated a dedicated computer operating continuously with sufficient storage capacity, a role fulfilled by the Geospatial Computing Platform (GCP). GCP proves to be an invaluable tool for executing processing tasks, thereby freeing up personal computers for other activities and mitigating the risk of interruptions due to restarts or updates during critical operations. The responsiveness and efficacy of support provided by CRIB staff, even during late hours, are particularly noteworthy.
For more information:
Prikaziuk, E., Silva, C. F., Koren, G., Cai, Z., Berger, K., Belda, S., Graf, L. V., Tomelleri, E., Verrelst, J., Segarra, J., & Ganeva, D. (2025). Evaluation and improvement of Copernicus HR-VPP product for crop phenology monitoring. Computers and Electronics in Agriculture, 233, 110136. doi:10.1016/j.compag.2025.110136
Prikaziuk, E. (2025) Evaluation and improvement of the Copernicus HR-VPP product for crop phenology monitoring, YouTube webinar, https://www.youtube.com/watch?v=-y_bNuJyDJU
This article is based on work from COST Actions CA17134 “Optical synergies for spatiotemporal SENsing of Scalable ECOphysiological traits” (SENSECO) and CA22136 “Pan-European Network of Green Deal Agriculture and Forestry Earth Observation Science” (PANGEOS) supported by COST (European Cooperation in Science and Technology).